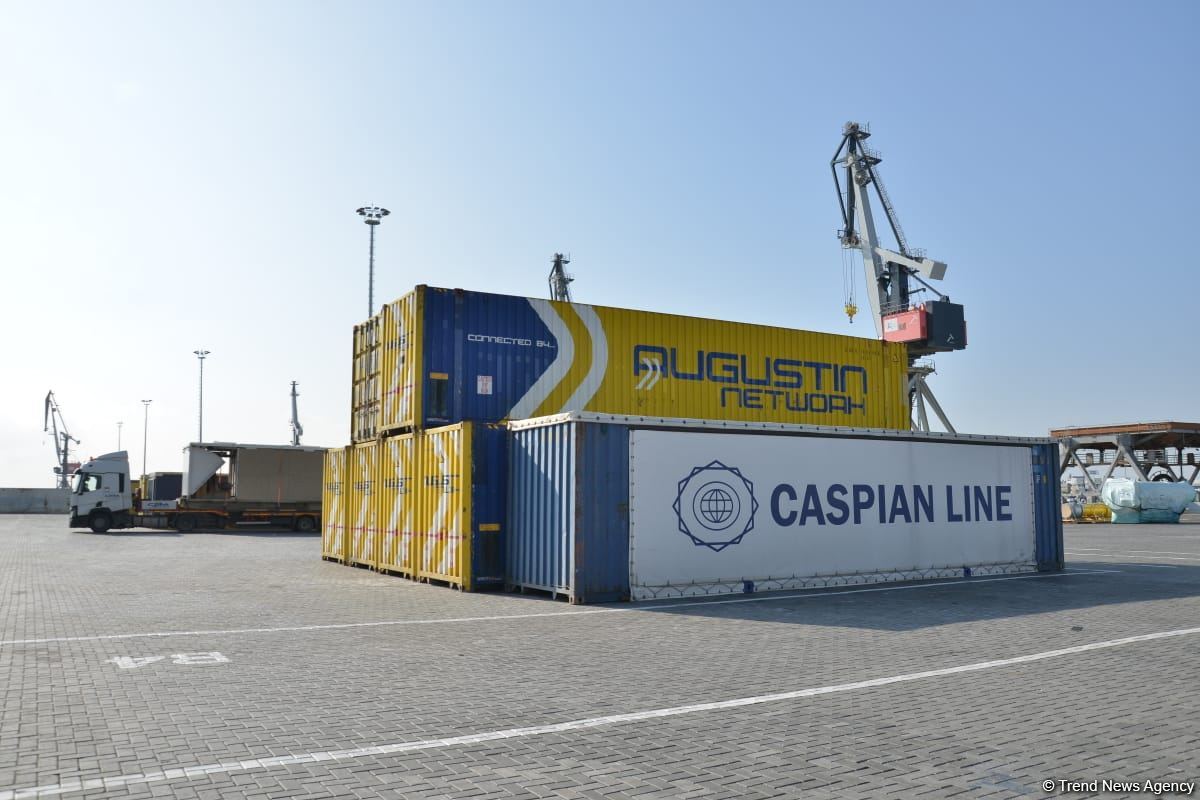
Azerbaijan counts trade operations with countries worldwide for 2024
Access to paid information is limited
If You already have a account, please log in
Subscription to paid content
Gain access to all that Trend has to offer, as well as to premium, licensed content via subscription or direct purchase through a credit card.
